Digital Banking Statistics 2026 [New Research]
Author: Dylan Buckley
September 08, 2026
9 min read
TABLE OF CONTENTS
- 1. Key Digital Banking Statistics (2026)
- 2. Mobile Banking Is Now the #1 Way Americans Access Their Accounts
- 3. How Digital Banking Adoption Has Grown Over Time
- 4. Digital Banking Adoption by Age
- 5. Digital Banking Adoption by Household Income
- 6. How Consumers Rate Their Banking Apps (iOS vs. Android)
- 7. Banking App Complaints Are Rising
- 8. Business Banking Is the Least-Satisfying Digital Banking Experience
Start your credit building journey for your business

Digital banking statistics give us insights into how consumers are banking, where their pain points lie, and digital banking adoption trends.
We’ve analyzed and compiled the most important digital banking statistics below.
Key Digital Banking Statistics (2026)
- Mobile banking is the number one way Americans access their accounts.
- 48.30% of all banked U.S. households use mobile banking.
- Those aged 18 to 24 had the highest rates of mobile banking adoption, with 76.60% using mobile banking.
- Older individuals prefer online banking, with individuals aged 65 or older making up the largest portion of those who bank online: 27.20%
- The higher a household’s annual income, the higher the likelihood of them banking online or using mobile banking.
- Consumers rate banking apps more highly on iOS than on Android.
- Business banking app complaints continue to rise. There are at least 100 new complaints each year.
- Business banking apps are the lowest-rated on Android. 8 out of 8 apps have been flagged for high 1-star share.
Mobile Banking Is Now the #1 Way Americans Access Their Accounts
Mobile banking is the most popular way for U.S. households to access their accounts and banking services. As revealed in the table below, 48.30% of all banked U.S. households use mobile banking.

Online banking users accounted for 19.80% of the share of all banked U.S. households.
| Primary way banked households access their account | Share |
|---|---|
| Mobile banking | 48.30% |
| Online banking | 19.80% |
| Bank teller | 15.10% |
| ATM / kiosk | 13.80% |
| Telephone | 2.30% |
| Other | 0.70% |
Digital banking services as a whole are more popular than other methods of accessing banking accounts. Combining mobile banking and online banking statistics, digital banking customers accounted for 68.1% of banked U.S. households.
A much smaller combined percentage (31.9%) would rather visit in person or use other methods to bank and access financial services.
While you can still visit your bank branch for traditional banking services, most prefer to turn to digital channels where they can manage digital transactions to their checking account, make a digital payment, and use online banking services wherever they are.
It’s easier than ever to jump online and get a free business credit check or use business credit monitoring tools on your phone or on your computer.
How Digital Banking Adoption Has Grown Over Time
Digital banking adoption rates continue to rise each year.
In 2017, only 15% of banked U.S. households were turning to mobile banking. Just six years later, in 2023, almost half (48.3%) of banked U.S. households were using mobile banking.
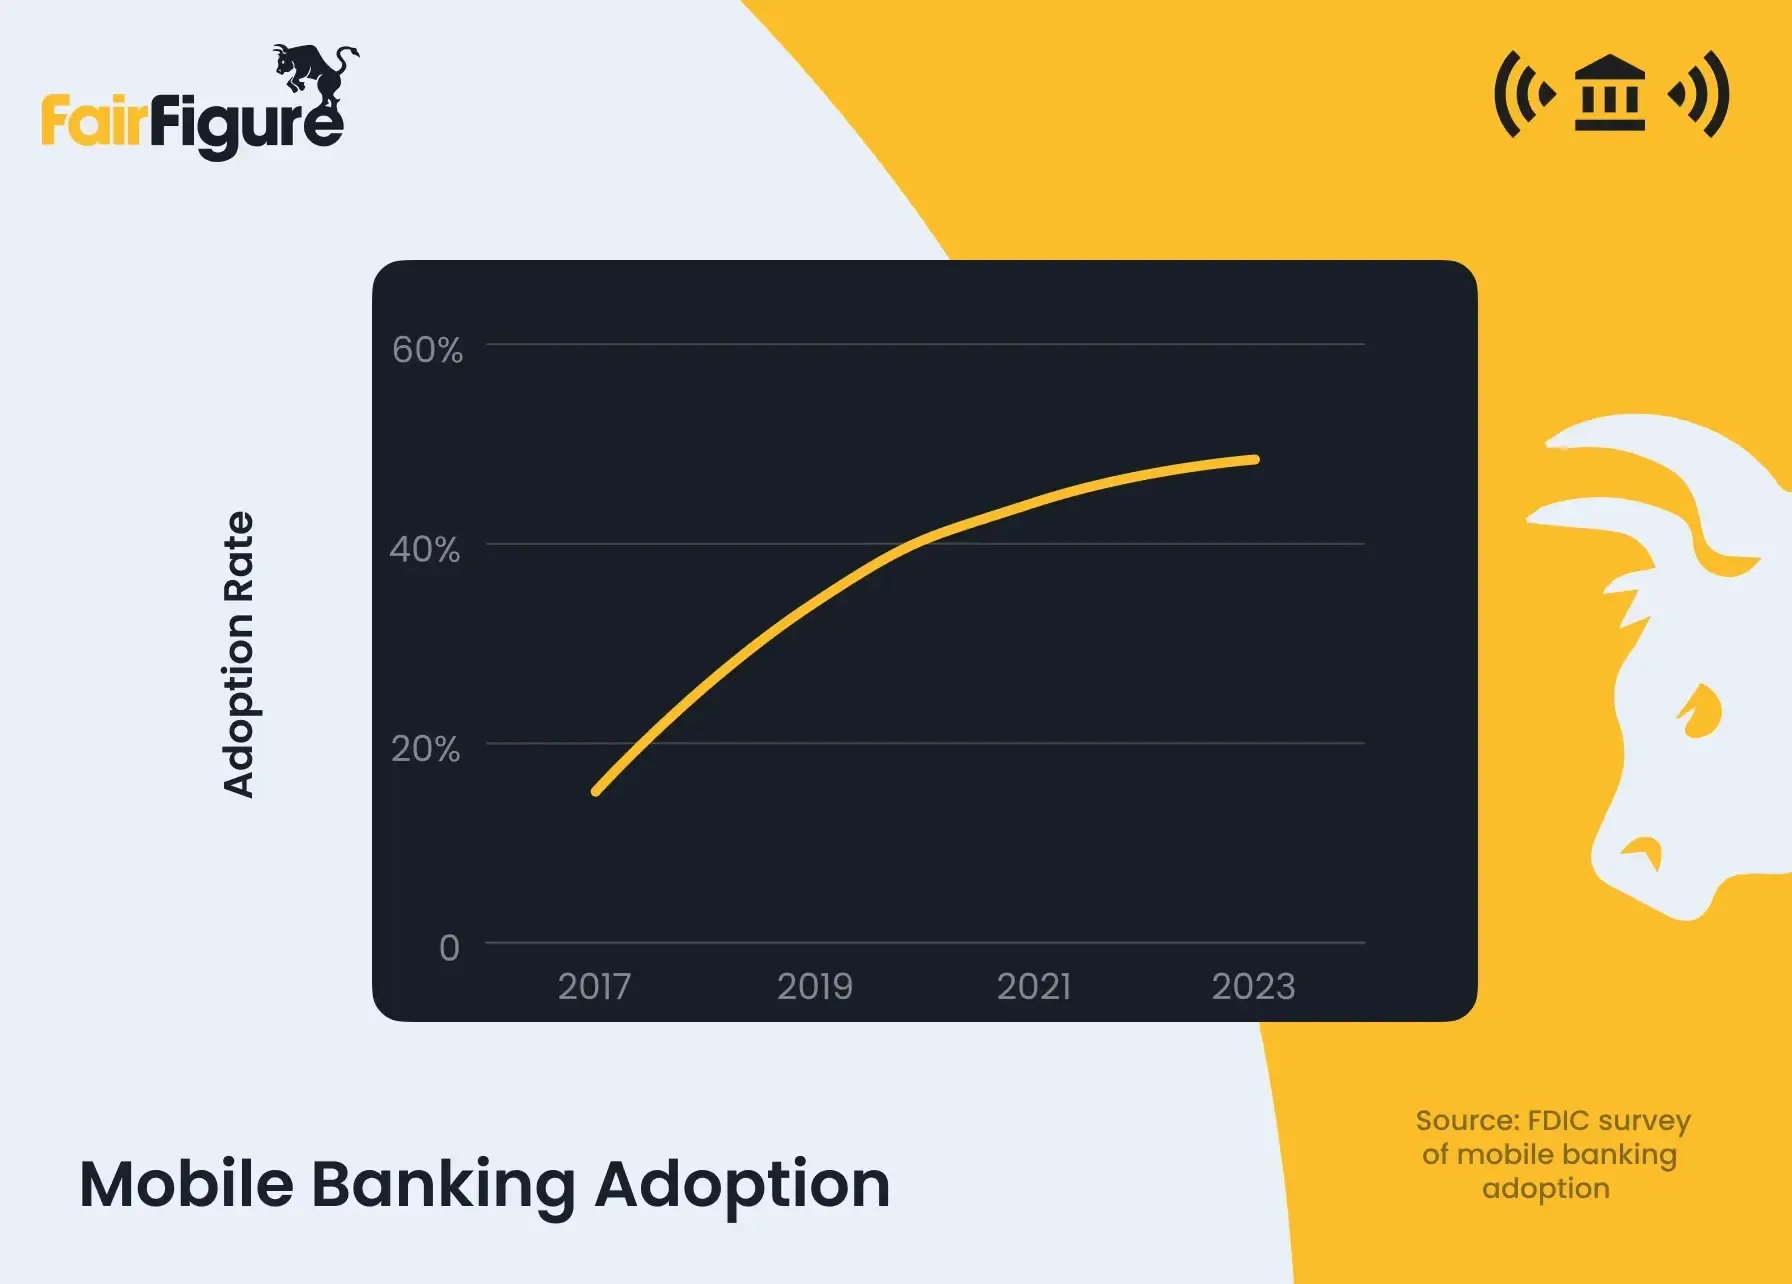
Mobile banking usage is likely to continue increasing with time, although we’ll need to wait for updated mobile banking statistics to reveal current trends.
| Year | Mobile Banking Usage |
|---|---|
| 2017 | 15% |
| 2019 | 34% |
| 2021 | 44% |
| 2023 | 48.3% |
Digital Banking Adoption by Age
Young adults are approximately 4x more likely than seniors to bank primarily by phone.
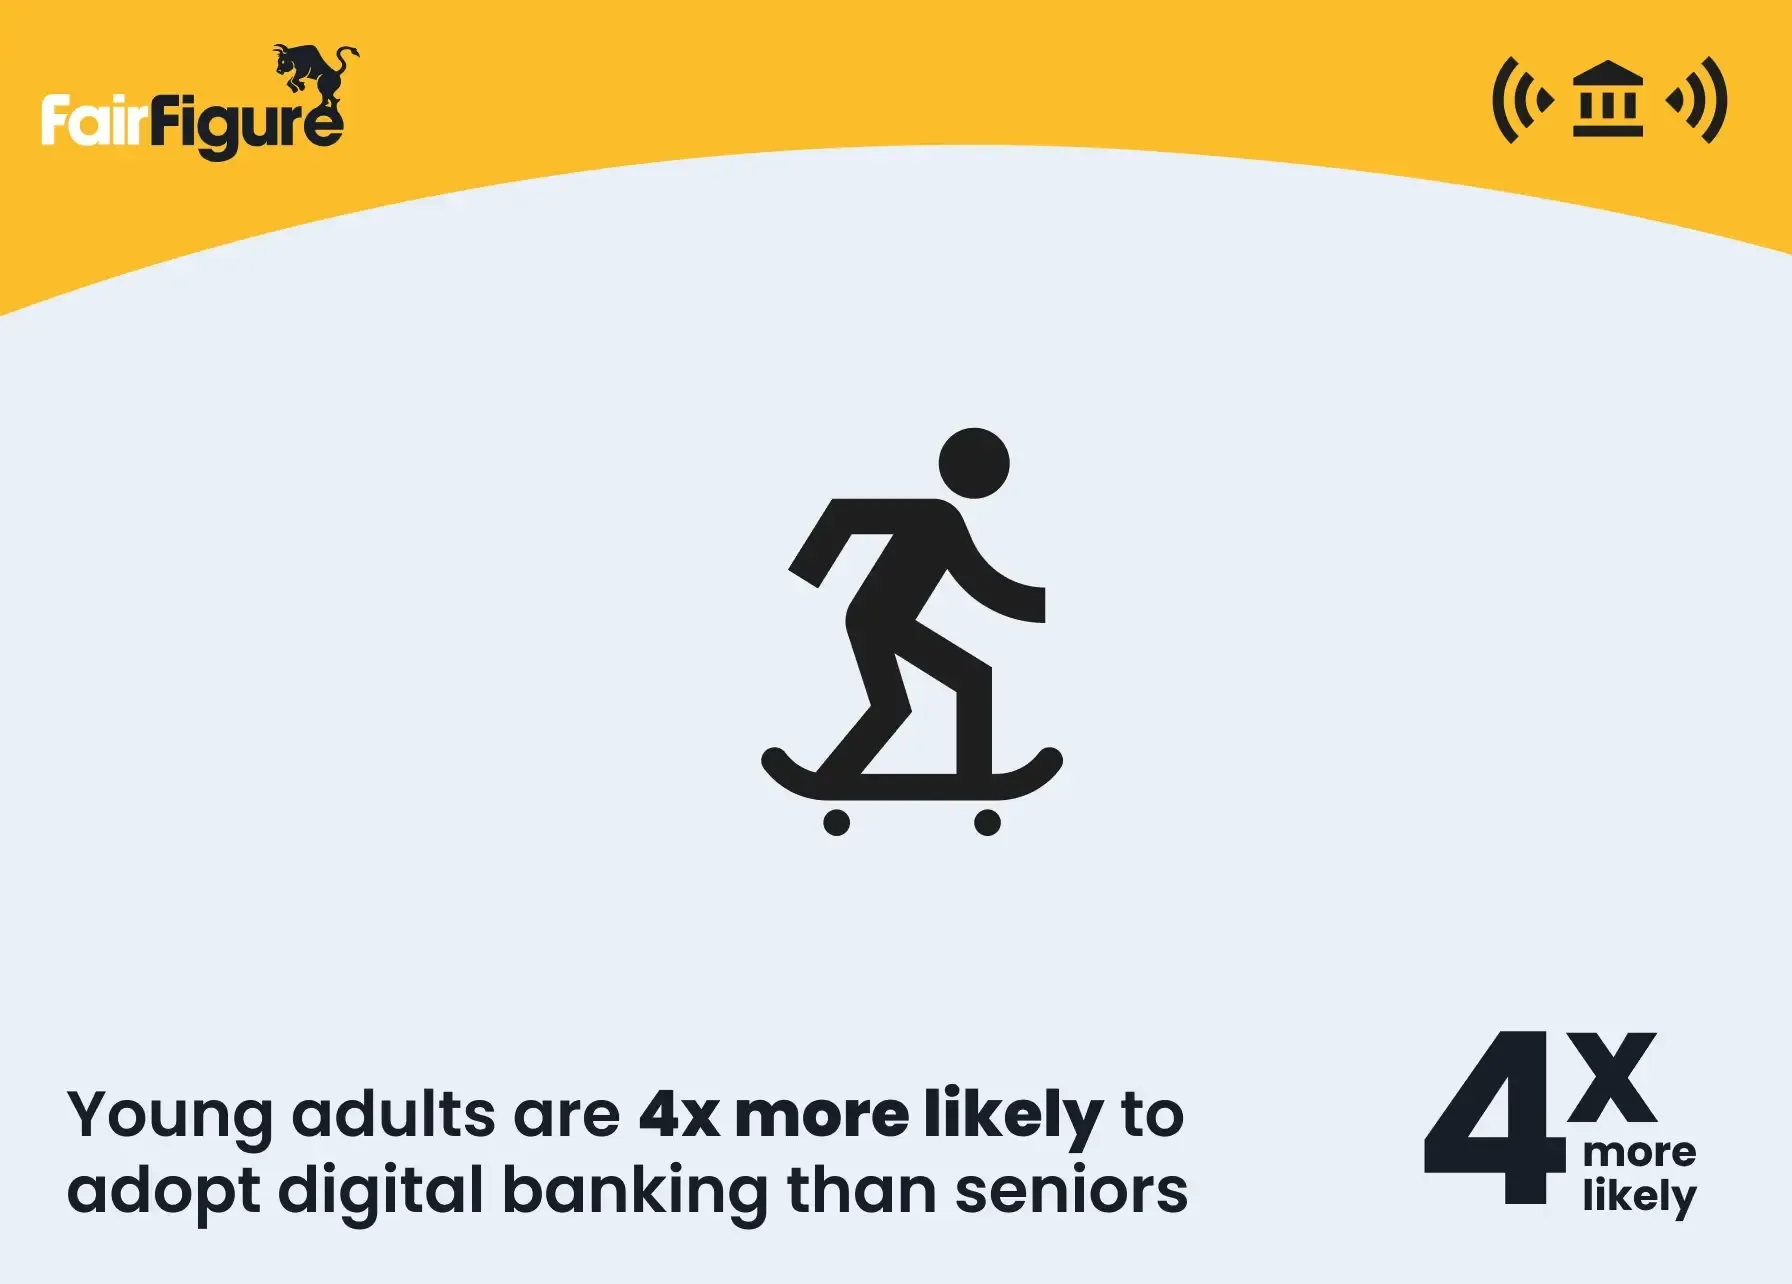
Data reveals that individuals aged 18 to 24 made up 76.60% of all banked households using mobile banking. Mobile banking users declined with each subsequent age group, with those 65 or older only making up 19.30% of all banked households using mobile banking.
Conversely, younger people used online banking at a much lower rate than seniors. Only 6.70% of individuals aged 18 to 24 used online banking. Meanwhile, those aged 65 or older made up 27.20% of all U.S. households using online banking to access accounts and banking services.
As a whole, digital banking use appears to decline with age.
For example, combined digital banking (mobile and online) is as high as 83.30% of all banked households using digital banking. This number drops to 46.50% for the 65 and older age group. Older groups prefer to use other methods to access their bank account and financial services.
| Age group | Mobile banking | Online banking | Digital (mobile + online) |
|---|---|---|---|
| 18–24 | 76.60% | 6.70% | 83.30% |
| 25–34 | 74.80% | 9.80% | 84.60% |
| 35–44 | 66.40% | 14.00% | 80.40% |
| 45–54 | 54.70% | 20.10% | 74.80% |
| 55–64 | 39.70% | 25.80% | 65.50% |
| 65 or older | 19.30% | 27.20% | 46.50% |
| All banked households | 48.30% | 19.80% | 68.10% |
Digital Banking Adoption by Household Income
Data reveals that household income can influence who (and what percentage) relies on digital banking to access their bank account and financial services.
U.S. households bringing in less than $15,000 only make up 35.10 percent of all banked U.S. households using mobile banking. This percentage rises to a much higher 55.60% once we reach the $75,000 or more annual income bracket.
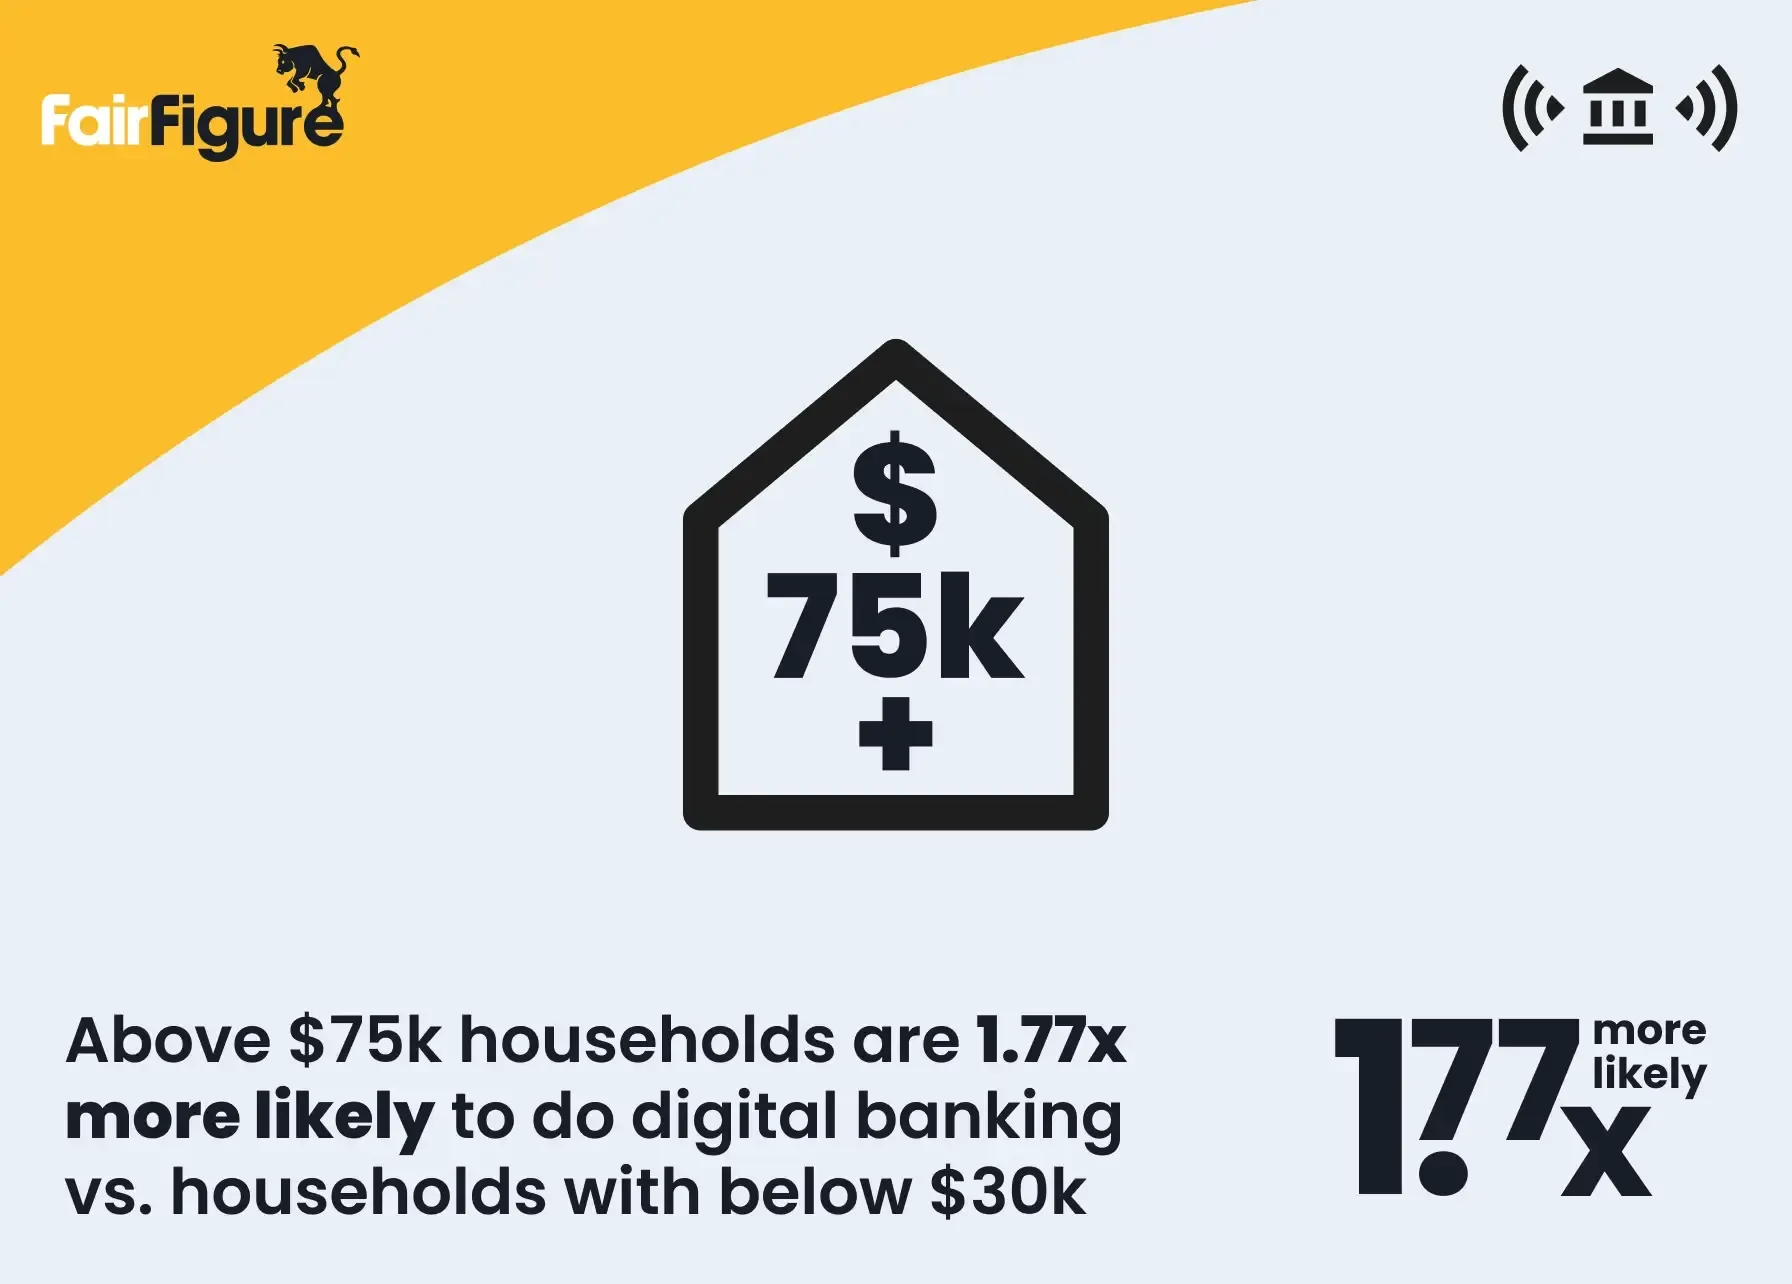
Online banking numbers are much lower. Only 10.20% of all banked households making less than $15,000 use online banking. This percentage only rises to 24.80% for households making $75,000 or more.
As a whole, digital banking users (mobile and online) increase with each income bracket. Of all U.S. households using digital banking, 45.30% of those making less than $15,000 were using both mobile and online banking.
This number increased significantly with each income bracket. Of all banked U.S. households, those making $75,000 or more saw a combined digital banking usage of 80.40%.
| Household income | Mobile banking | Online banking | Digital (mobile + online) |
|---|---|---|---|
| Less than $15,000 | 35.10% | 10.20% | 45.30% |
| $15,000–$30,000 | 31.90% | 13.50% | 45.40% |
| $30,000–$50,000 | 42.80% | 14.90% | 57.70% |
| $50,000–$75,000 | 48.80% | 18.30% | 67.10% |
| $75,000 or more | 55.60% | 24.80% | 80.40% |
| All banked households | 48.30% | 19.80% | 68.10% |
How Consumers Rate Their Banking Apps (iOS vs. Android)
Most banks fared similarly when it came to iOS gaps. The lowest rating banking apps (business/SMB apps) received on iOS was 4.74 on average. Neobanks/fintechs, traditional bank apps, and credit unions had ratings of 4.8, 4.83, and 4.87, respectively.
Android app reviews for mobile banking apps were lower. The highest gap was for credit unions, which received an average of 4.26 stars. Traditional banks had a very minimal gap, while neobanks/fintech apps and business/SMB banking apps sat in the middle.
Your average traditional financial institution tends to fare better in terms of ratings. This includes online banks and banks with physical locations, and the same applies to credit unions.
| Bank Type | iOS | Android | Gap |
|---|---|---|---|
| Traditional banks | 4.83 | 4.71 | 0.12 |
| Credit unions | 4.87 | 4.26 | 0.61 |
| Neobanks / fintechs | 4.8 | 4.45 | 0.35 |
| Business / SMB | 4.74 | 4.47 | 0.27 |
There may be a few reasons for this:
- There appear to be fewer reviews on the Google Play Store in comparison to the App Store for many digital bank apps. This will impact app ratings. Where one app might have hundreds of thousands of reviews, other apps may only have a few thousand.
- How people rate apps seems to differ across platforms. For example, the Navy Federal Credit Union on Android received 1-star reviews for its most recent updates. iOS users had issues here and there but gave a higher rating.
- There could be differences in app functionality across platforms. However, this is merely speculation and can be influenced by factors such as the age of the device being used, bugs, and similar problems or characteristics.
The largest gaps were as follows for each listed mobile banking app:
- Navy Federal Credit Union had a gap of 1.2.
- Golden 1 had a gap of 1.1.
- SoFi had a gap of 0.9.
- Venmo had a gap of 0.8.
Banking App Complaints Are Rising
Continuing with the above, banking app complaints seem to be rising as a whole. While we don’t have the full picture yet for 2026, it’s estimated that there will be 100 more complaints this year, following a yearly trend of 100 new complaints annually since 2024.
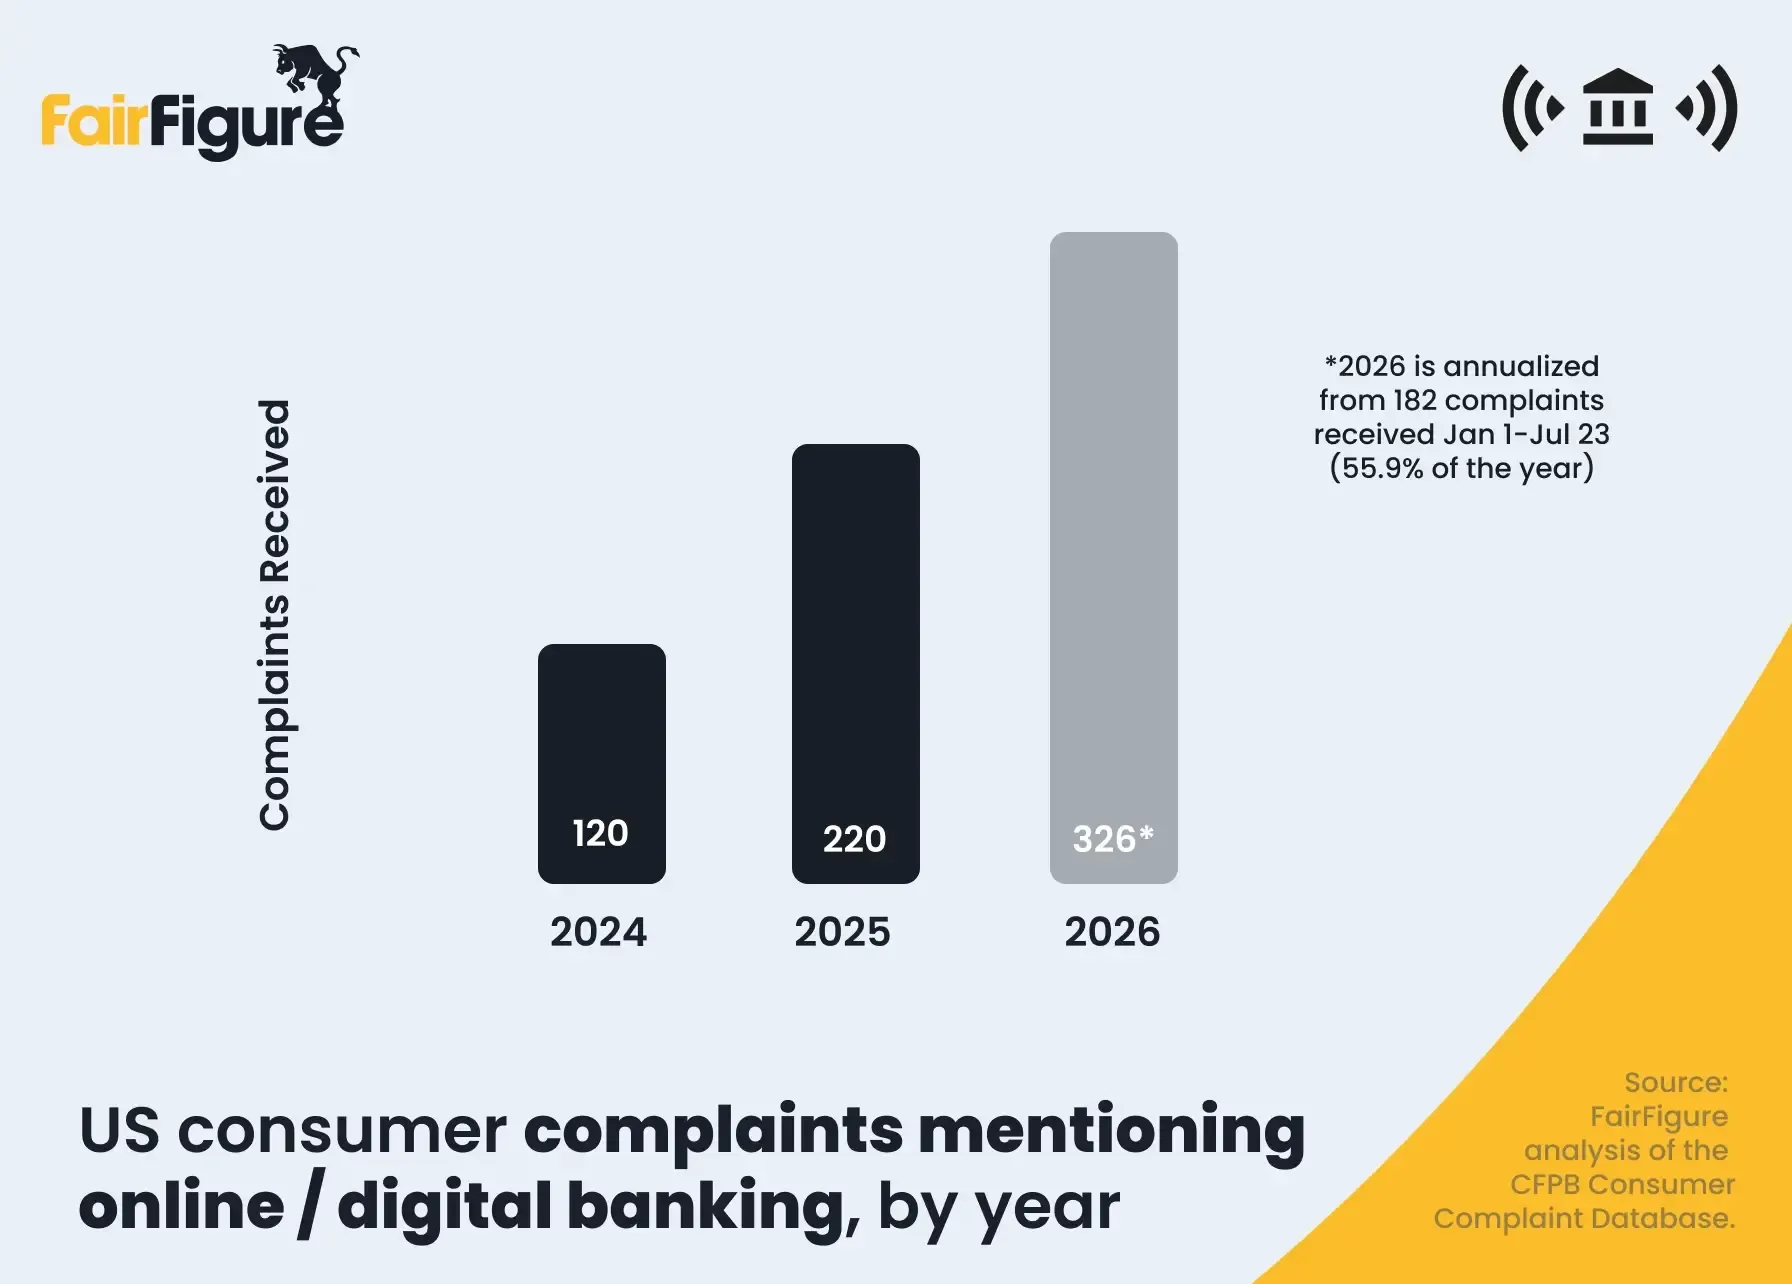
There was an 83% jump from 2024 to 2025 alone.
Online / Digital Banking Complaints by Year
| Year | Complaints | Note |
|---|---|---|
| 2024 | 120 | Full year (observed) |
| 2025 | 220 | Full year (observed) |
| 2026 | 326* | Annualized from 182 complaints received Jan 1–Jul 23 (projected) |
Some of the reasons why consumers are filing complaints include:
- 37% of those filing complaints cited managing their account as the single biggest pain point.
- 8.7% complained about being a victim of a scam or fraud, or they had unauthorized transactions on their account.
- 6.6% cited account closures as their complaint.
The product mix related to complaint holders was about 54% checking and savings, with 18% of complaints related to money transfers or virtual currency.
Business Banking Is the Least-Satisfying Digital Banking Experience
Business banking continues to disappoint users when it comes to the digital banking experience. Not only are the lowest-rated on iOS stores out of all the banking categories (4.74), but they also get the universal Android 1-star flags.
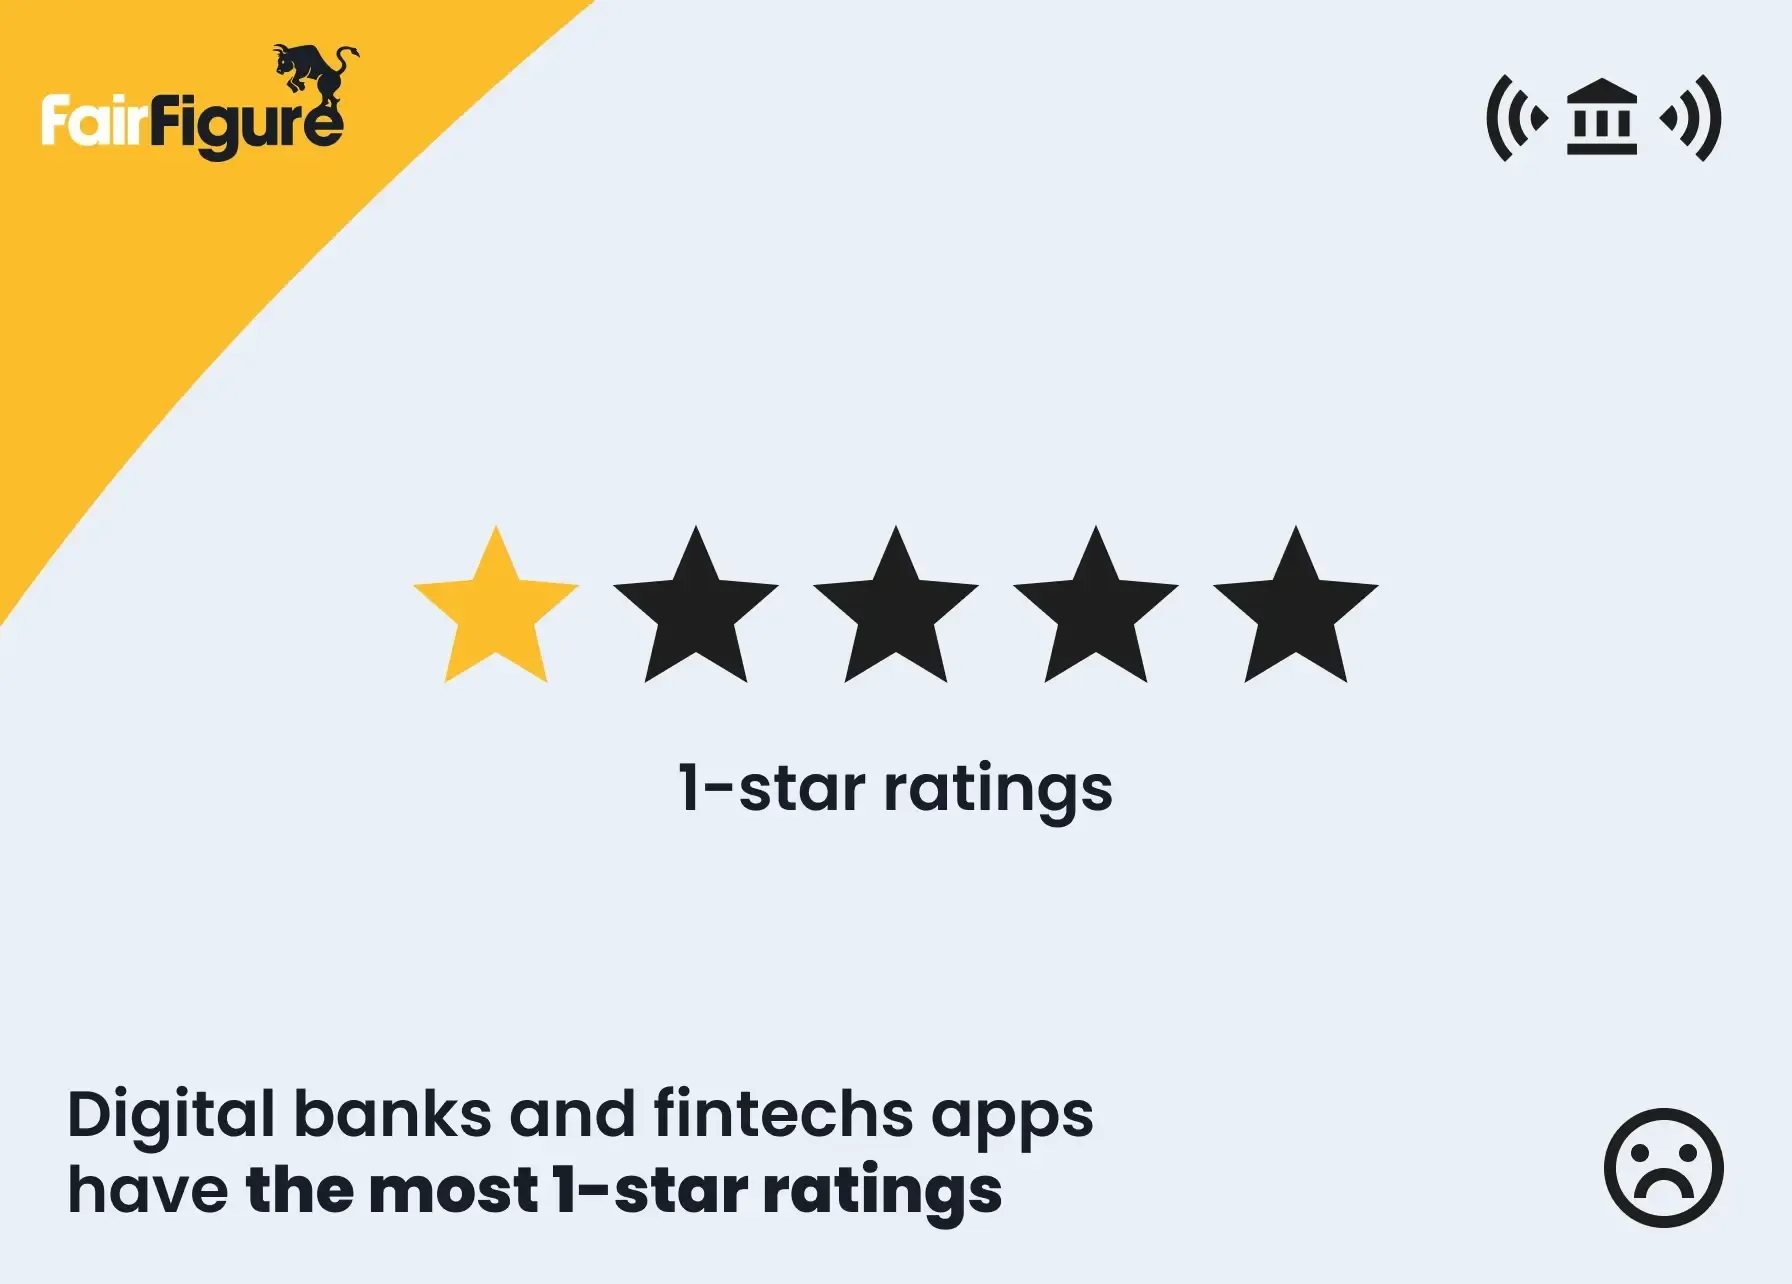
The further you move away from traditional banks, the higher 1-star complaints climb on each digital platform.
| Bank Type | Apps flagged for high 1-star share (Android) |
|---|---|
| Traditional banks | 3 of 8 |
| Credit unions | 4 of 6 |
| Neobanks / fintechs | 7 of 8 |
| Business / SMB banking | 8 of 8 |
Frequently Asked Questions
What Percentage of People Use Digital Banking?
68.1% of U.S. households use digital banking, either turning to mobile banking or online banking as their preferred way of banking.
Is Mobile Banking More Popular Than Online Banking?
Yes, mobile banking is more popular than online banking. While only 19.80% of U.S. households rely on online banking to access their bank account and financial services, 48.30% use mobile banking.
What Is The Most Common Online Banking Complaint?
The most common internet banking complaint was related to account management. 37% of complaints highlighted this extremely common problem when banking digitally.
Methodology
For the bulk of our insights on digital banking services above, we used the FDIC Public-use Current Population Survey (CPS) Unbanked/Underbanked households data, which ranges from 2009 to 2023.
Banking app rating data was calculated internally from Android and App Store public app ratings.
Meanwhile, banking app complaints were calculated using data from the Consumer Complaint Database from the CFPB.
More articles
Read More >
October 08, 2026
15 min read

October 08, 2026
12 min read

October 08, 2026
13 min read
Start your credit building journey for your business
Start your credit journey now with FairFigure